
eBay’s ‘Listing Quality Reports’ - where they are, and why they are awesome
Oh hello lovely people! I just flew back in from speaking in the eBay ‘Sell Smarter’ section at Retail Fest. Was a great day, I was stoked to be invited! I’ll embed the livestream once it is sent to me.

One of the things I mentioned while up on stage was how important it is to utilise the eBay Listings Quality Report. This is one of my favourite tools for optimising eBay listings for all of my clients, it is basically the oracle by which all should be measured.
Now, the tricky part: NOT EVERY SELLER HAS ACCESS TO THE LISTING QUALITY REPORTS! The reports were actually discontinued by eBay a little while ago, but due to popular demand (which includes myself being quite ‘vocal’ to anyone at eBay that would listen) they are trickling back in to each eBay account.
They can be found in your eBay Seller Hub by hovering over ‘Performance’ and clicking on ‘Traffic’. If your account is enabled for Listing Quality Reports, you’ll see the button here:

Click this, and it’ll download an Excel spreadsheet, which is updated roughly every two days. You cannot access a back-catalogue of these, so I’d suggest downloading them each day and storing them in a folder somewhere so you can track your progress.
I have around twenty clients selling on eBay, and it seems as though all but three of these accounts have access to the Listing Quality Reports. I cannot see any rhyme or reason as to who has them enabled and why, but there you go.
These reports are very deep, but I’ll give you a quick overview of their function (I have anonymised all data in my sheet here so none of you creeps can snoop!)
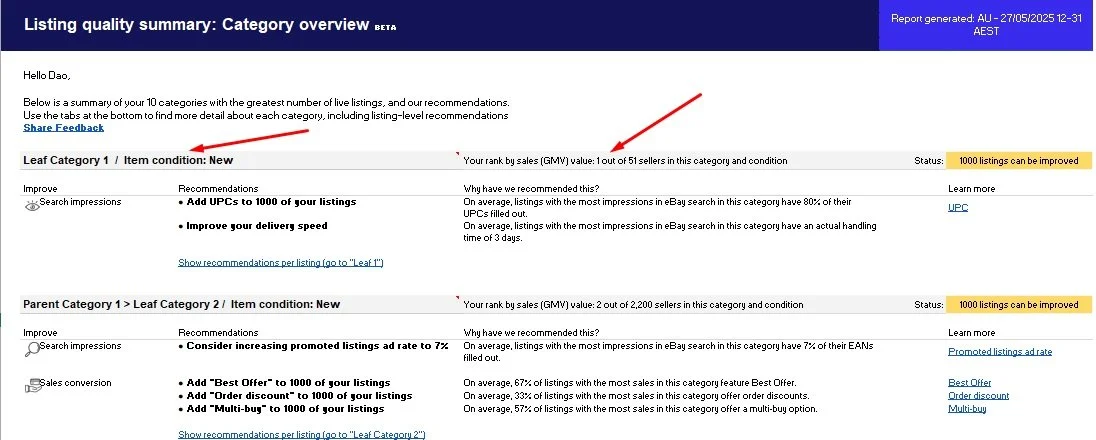
The first page is the Listing Quality Summary. This gives you a brief rundown of your rankings in your top 10 selling eBay categories. This page also gives you a quick summary of suggestions to improve sales in each category, based on data collated from all the other sellers in your vertical.
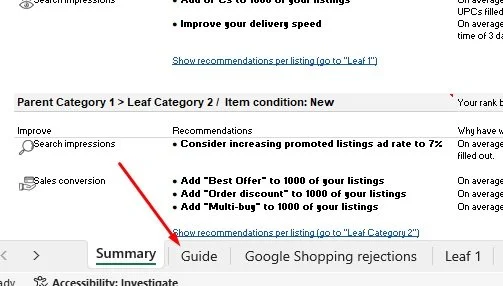
I won’t explain in too much detail, as there is a quick summary in the ‘Guide’ tab at the bottom of the Excel spreadsheet.
The third tab is Google Shopping rejections. These are listings that you’ve created that eBay can NOT push through to Google Shopping. This is super important, as the majority of your eBay sales come from Google searches linking through to your eBay listings. Mine looks like this:

I’m gonna go ahead and give myself a pat on the back, as I’m doing all the right things by eBay, and being rewarded by having all of my listings pushed through to Google Shopping. eBay spends more money on Google advertising than any other eCommerce business in the world, so I’m happy to do the right things and reap the benefits.
Below is an example of a Listing Quality Report from one of my clients when we first started working together:

Each Listing Quality report only summarises a handful of listings at a time for the Google Shopping rejection report, and you can see that these naughty boys and girls have watermarks on their images. While watermarking your business logo onto (or over) an image might seem like good advertising, it is actually causing you a disservice as eBay will not push it through to Google Shopping. These guys also had some images that were too small, eBay requires at least 500px x 500px (I’d recommend at least 1000px x 1000px if possible).
Scrolling down, you can see the non-compliant listings, and why they are deemed ‘non-compliant’.

These are all hyperlinked so if you create and edit all listings directly within eBay, you can link straight to the offending item and repair it. If you use a decent third-party management tool such as Maropost (which you should be) you can use the eBay item number to search it up.
Once you’ve fixed these, you’ll find that the next report will have the next 250-odd non-compliant listings, which you can then repair. This client had 17,000 listings when I started working with them, and EVERY SINGLE ONE was non-compliant. Working through these increased their traffic exponentially, now they would not be caught dead having watermarks or cruddy images in their listings.
The rest of your sales come from searches within eBay - the next Excel spreadsheet tabs give a more concise breakdown of each of your top 10 categories, where you rank, and how to improve.

Above, you can see eBay’s ‘Buyer Funnel’, which shows the breakdown of your impression/clickthrough/conversion metrics. You can see in the top right of the image that I’m ranked third in this category, and there are 656 sellers (including myself) competing for the top spot.
656 sellers in this ONE category. All trying to get a sale. Each sale they get, is one less sale that you get. Think about that for a moment. You need to do whatever you can to improve.
Using the data supplied, you can infer some ideas as to how to improve. I’ll break these down for you:

The top of the funnel is ‘Impressions’. This is how many times in a day that someone sees one of your listings in a search result within eBay. You know, at this stage of the eBay buyer experience:
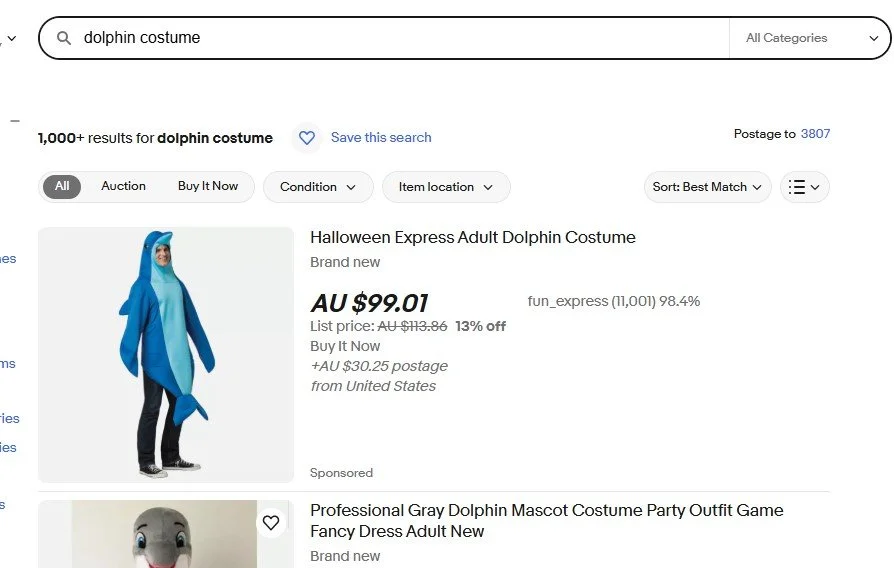
I can see that I’m ranked second in this category (no I don’t sell or buy dolphin costumes, this was just an example), so I must be doing a damn fine job. There are many factors that go into getting good impressions (I’ll go into this in depth another day) but a quick summary is:
Title length (as close to 80 characters as possible)
Image quality/quantity
Pricing
Listing promotions
Sell-through percentage of the listing (three sold, three still available - 50% sell-through)
And a whole bunch of other factors.
Honestly, there isn’t much I can do to improve these listings and their impression count (besides spending more on eBay Promoted Listings, which I’ll also touch on again another time) so lets just move down the funnel.

Click-through rate is important. This identifies how attractive your listings are compared to other sellers, and each time someone clicks into one of your listings from a search within eBay, it affects these metrics. You can see that the click-through rate is 0.32% (this means that for every 10,000 impressions, 32 people have clicked into my listings). I’m ranked fourth against the other 655 sellers in this category, which isn’t too bad, but it could be better.
Factors that might negatively affect your click-through rate could be:
Being too expensive
Cruddy main image
Ineffective title keywords/structure
A stupid eBay username (no joke, I saw someone selling sporting goods with the name ‘sexycommodoredriver’ once)

The bottom of the funnel (and arguably the most important part) is ‘Sales Conversion’. This is a percentage based on:
People that clicked into your listing / People that purchased your item
My conversion rate shows that almost one in five people that click into my listings in this vertical are buying it. That’s pretty darn good. Still, the rank of fifth against the other 655 sellers in this vertical could be better…although, this rank is based on percentage, not total sales; if a seller has two clicks into their items listed in the category and sells one, their conversion rate would be 50%.
Opportunities to improve conversion rate come in many shapes and sizes, and may include:
Quality and quantity of images
Quality of description
Purchase terms (Returns policy? Shipping time? Stupid caveats imposed by the seller such as ‘will not ship to you if your name sounds dumb’?)
Depth and quality of item specifics (again, another thing I’ll touch on in depth one day)
Store quality (Feedback percentage, warranty terms, shipping options)
And a whole bunch of other factors
Scrolling down the Excel spreadsheet and you can see in-depth detail about each listing:
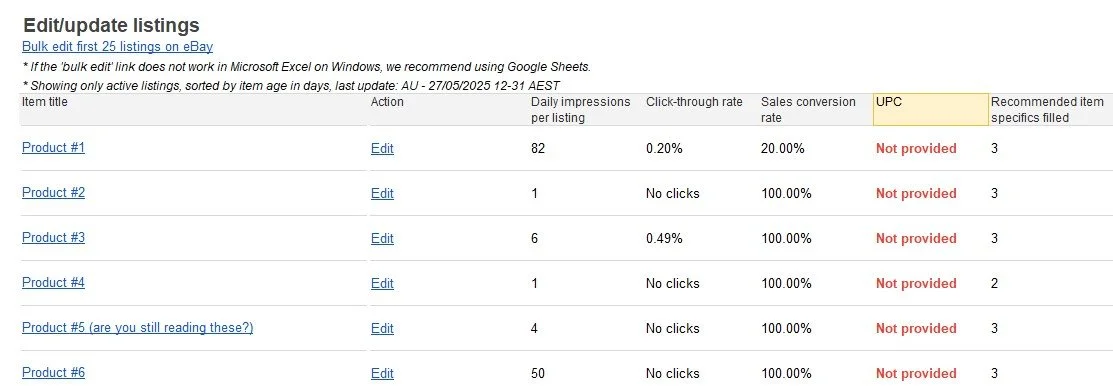
We can see here that product #1 gets a lot of impressions, but eBay have highlighted the ‘UPC’ column as I have not put in the the UPC codes for this range of products I sell in this vertical. Thanks for the hot tip, eBay, I’ll now hassle my suppliers for some data to pad out the UPC fields in these listings. Theoretically, this should rank me higher in search results, and get more sales. Woohoo, money is awesome!
I highly, highly recommend downloading your Listing Quality Reports on a daily basis (remember, they update every second day on average, but do it daily so you get used to it). This is the single best litmus test into the quality of your listings and your store, and I use this to build direction and a plan of attack for improving the sales of every client I work with.
Make it a habit. Do it dogmatically, all the time. It is well worth it. Then track your metrics, and be rewarded when you see things like this:
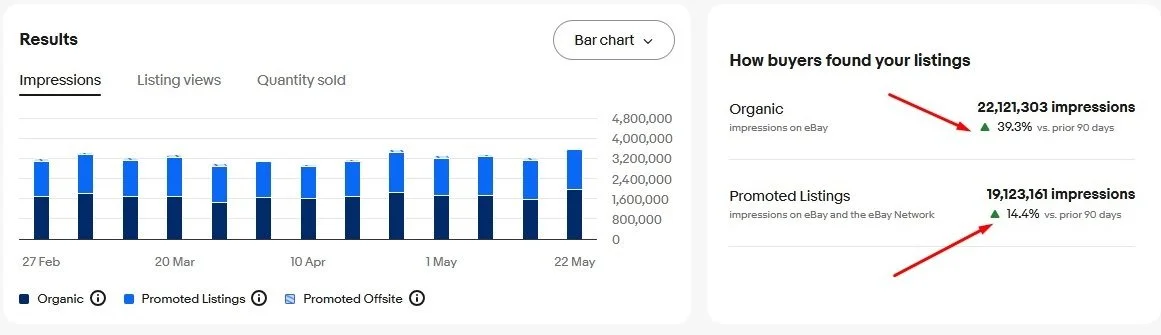
Woohoo! Time to buy some cool stuff!
What tips for eCommerce selling would you like next? Please let me know and I’ll get on it.